
Rhythm estimation
Overview
Rhythm is an important information for understanding audio data. On both music and speech analysis, the rhythm can help to describe and segment different kind of phenomena. The approach we present led us to propose two new representation : The Rhythm Spectrum and the Tempogram
Our approach is not based on any musicological or speech knowledge and aims at finding periodicity in changes of any kind of audio signal. The proposed method is computed using two steps :
- segmentation of the signal
- frequency analysis of the boundaries position
Some examples of applications performed using our method
Method
Segmentation
The segmentation we use is the Forward-Backward divergence segmentation proposed by André-Obrecht[1]. Originally designed for the segmentation of speech into sub-phonetic area, this segmentation splits the music signals into segments close to the Attack/Decay/Sustain/Release phases of the note. This property can be seen on the figure below, presenting the segmentation of a sigle note on the wavform and spectrogram.
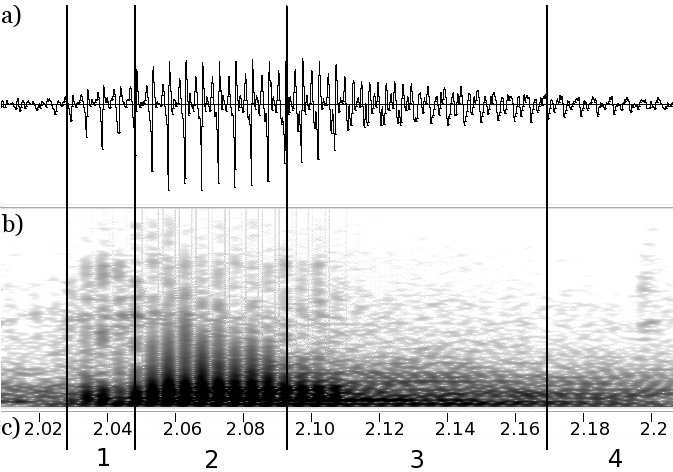
The phases of Attack, Sustain and release are respectively labeled 1, 2 and 3.
The goal of our approach is to use this property to have stationary segments to analyse the positions of the boundaries of those segments. To do so, we will use a frequency analysis of those positions.
Frequency analysis
The frequency analysis of the boundaries rk is performed using the creation of a signal b(t) as a Dirac signal, a Dirac existing for every position rk.
b ( t ) = ∑ k = 1 N δ ( t − r k )
The Fourier transform B(f) of this signal can therefore simply be expressed, using the property of the Fourier transform of a Dirac signal:
B(f) = ∑ k = 1 N â…‡ – 2 â…ˆ π f r k
However, using this expression, every boundary worth the same in the analysis. We thought that it would be interesting to enhence the boundaries located at the begining of notes or vowels as they are more relevent for rythmic information.
We propose a weighted function based on the energy difference. We give more weight to boundaries located at instant experiencing an increase of energy as they are more likely to be start of note or vowel.
The modified expression of B(f) called Bw(f) is :
B w (f) = ∑ k = 1 N â…‡ – 2 â…ˆ π f r k p( r k )
We call this frequency representation of weighted boundaries the Rhythm Spectrum. It succeeds at revealing rhythm structure on audio records as shown in the figure below.
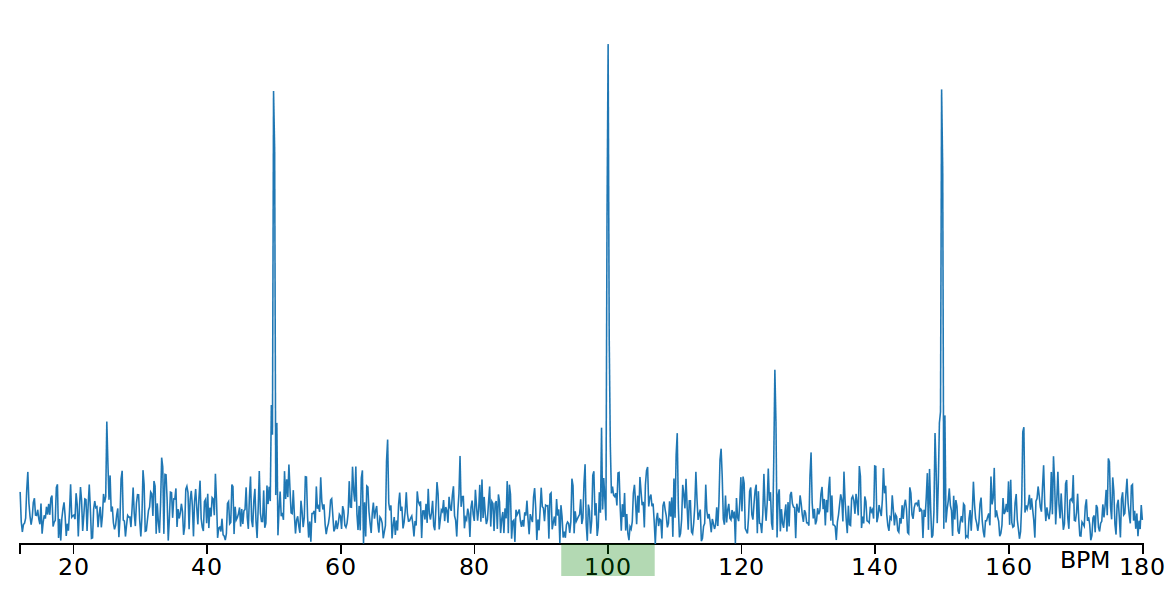
Rhythm spectrum of a pop music song annoted at 100 BPM
Tempogram
This spectral representation of the rhythm can also be computed on a sliding widow analysis. This representation is the equivalent of the spectrogram for the energy spectrum and is therefore named tempogram. It aims at representing the evolution of rhythm in different phases of the same recording as shown in the figure below.
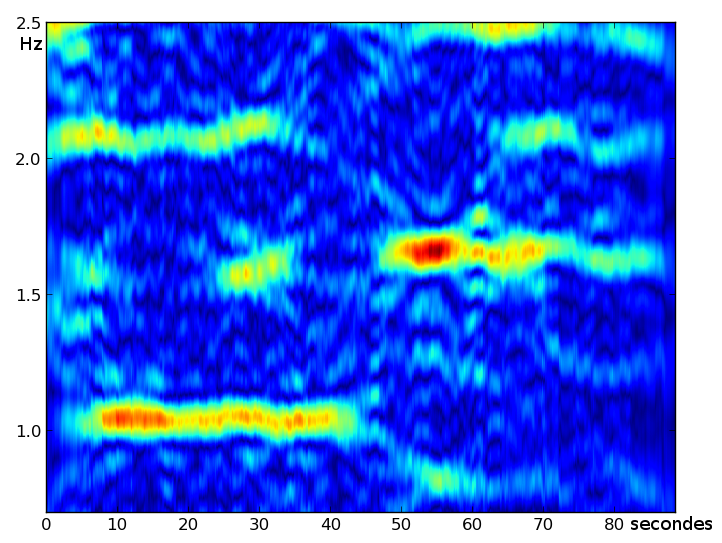
Tempogram of a signal containing two different rhythms
Contributors
- Maxime Le Coz (lecoz@irit.fr)
- Régine André-Obrecht
- Julien Pinquier
- Hélène Lachambre
- Lionel Koenig
Main publications
[1] Maxime Le Coz, Régine André-Obrecht, Hélène Lachambre, Lionel Koenig. A Segmentation-Based Tempo Induction Method. In : Internationnal Society for Music Information Retrieval Conference, Utrecht, Netherlands, Dragstuhl Research Online Publication Server, p. 27-31, 2010.
References
[1] Régine André-Obrecht. A new statistical approach for automatic speech segmentation. Dans : Transactions on Audio, Speech, and Signal Processing, IEEE, Vol. 36 N. 1, p. 29-40, 1988.