
Adaptative User-Defined Similarity Measure
Context
With the aim of audiovisual database consulting, without being limited to a predefined applicative context, the prospect of a user-dependent interactive visual organization should be enviable: with S a same small subset of documents, a user should have the possibility to explore several geographical representations of it; the rest of the corpus (or a part of it) has to reorganize itself regarding the notion of similarity expressed by the human on S.
Overview
We want to develop a system with respect to several principles:
- Context-free user behavior: We do not want to focus on a particular trade (documentalist, montage specialist…). This precise point encouraged us to design an uncluttered dynamic interface, without any trade-oriented information, that is used for both similarity learning and result presentation.
- Documents heterogeneity: Any kind of mono-media or multi-media document should be accessible in the same way (textual modality has not been explored yet).
- Lack of descriptive values information: The field of semi-supervised audiovisual analysis we are interested in relies on low-level features extraction and modeling. We consider that descriptors we have are independent (so descriptive values computed on documents are), and that we do not know their behavior: Are they linear, logarithmic, etc…? What are their minimum and maximum values? Are they continuous or not?
- Resulting application as generic as possible: Similarity is used in classification, identification and characterization tasks. Our application has to cover the possible accomplishment of any task relying on those three aspects of the expression of similarity. We will use the global term of organization to evoke them. We want to create an interactive system that allows to learn a user-defined similarity and to organize a database with the same Graphical User Interface (GUI).
This problematic leads to focus on two points of view: a subjective one relying on user-defined audiovisual similarities, and an objective one that depends on low-level descriptive values.
GUI
Fonctionalities
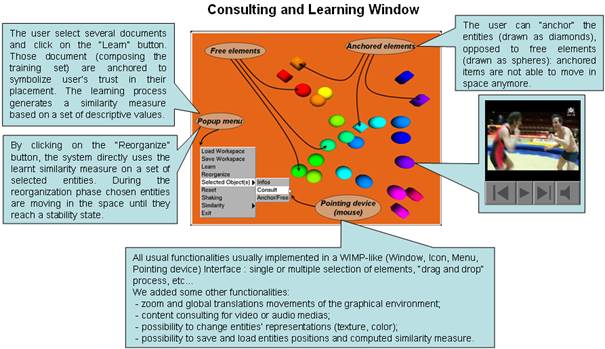
Dynamic visual engine
We decided to consider visual entities as physical particles and to implement a “mass spring” dynamic physical model. We implemented this model with the four order “Runge-Kutta algorithm”, a temporal explicit integration schema known to be very accurate and well-behaved for a wide range of problems. The global set of documents is considered as a complete graph whose nodes are weighted particles and edges are springs.
Given an arbitrary time step, this algorithm computes the new position of a point with an approximation of its velocity, regarding all the implemented physical constraints which are:
- the weight of a particle,
- an attraction force that is proportionate to the expected spring length / actual spring length ration,
- a moderation force adjoining the particle, proportionate to its velocity, that constraints the system to reach a stability state even if it does not exist,
- the strains of the springs.
Learning Engine
Features
In this study, we have chosen to focus on documents whose durations are less than three minutes, and to exploit:
- 8 audio descriptors used for speech/non-speech segmentation: classical ones such as energy or fundamental frequency, and others such as 4Hz energy modulation or entropy modulation (go there for more details),
- 9 video descriptors such as contrast, luminance and activity rate (all used here).
The temporal dimensionality has not been exploited here: for a document and the set of values computed with a particular temporal detector, we have chosen to consider the mean, the standard deviation, the minimum and the maximum of this set.
Therefore a document is represented by a 68 dimensional vector, each dimension (i.e. descriptor) is considered as independent. This applicative context is not fixed: in our system, every kind of descriptive values may be used as a new descriptor as soon as it is numeric. Of course their usefulness depends on the considered corpus and the granularity of what we consider as a document: relevant descriptors to characterize video shots are not the same for a collection of TV broadcasts.
Adaptive similarity measure
The main idea is to generate a behavioral model of a set of descriptors. This model has to be representative enough of the arrangement made by the user in the visual interface.
We choose an early fusion strategy because of the heterogeneity of our features and the lake of information we have about them. We apply it inside a modality (audio or video) and between them.
We use the following “Min-Max” normalization method: each feature is scaled in a [0,1] range before being concatenated.
The Mean Square Error (or MSE) has been chosen as an indicator to process our similarity measure.
To summarize, each pair of documents, placed by the user in the visual space, generates a normalized distance value and a vector composed by normalized concatenated descriptive values. We choose a regressive model to bind them.
Furthermore, an iterative concatenation process specifies which descriptors to keep, to constitute a good model. Here is a short explanation of the general idea:
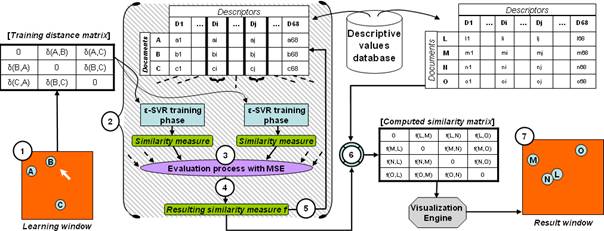
- After the dynamic user’s organization phase (1), regression models are created (one model for each feature vector) by iteratively concatenating descriptive values (2).
- We use the MSE to evaluate whether a regression is better than another (3).
- Iteration is done by concatenating the descriptive values that give the best results (regarding the MSE) at each algorithm step (4). This is done until the algorithm leads to a Loss of Performance (i.e. the best MSE performed at step p is lower than at the one at step (p+1)) or to an Information Redundancy (i.e. the best descriptor found at the actual step has already been chosen during the iterations) (5).
- The predictive phase (6) consists in the application of the previously computed regression on a new subset of documents to generate a similarity matrix.
- Finally the dynamic visualization engine generates a new distance matrix from the similarity matrix at each time step until the global schema reaches a stability state (7).
Contributors
- Jérémy Philippeau
- Philippe Joly (contact)
- Julien Pinquier
- Jean Carrive