Demonstrations
This page is dedicated to demonstrations related to applications and tools implemented by our group:
| Abrose | AMAS4BigData | Ants |
| CoCell | Drones | Dynamo |
| Gama | microMega | Progressive party problem |
| Molecule folding | Equation solving | Conveyor robots |
| Staff | Synamec |
To download these demonstrations, click on the images or links towards video.
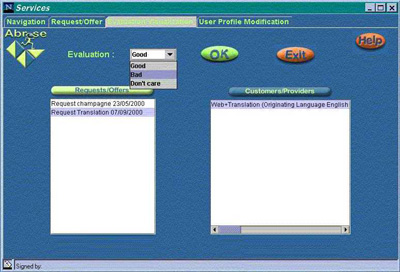
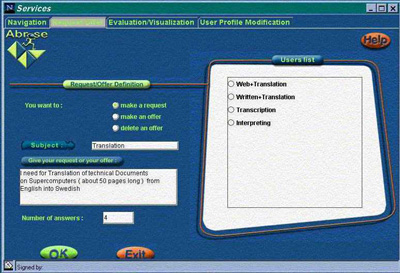
ABROSE
ABROSE is a prototype of an electronic brokerage service implemented during an European project. It provides automatic compositions of services and improves, through exchanges and use, the knowledge about the offered services. In this system, the profiles of service providers and customers are maintained in a dynamical way from the contents of their interactions.
- Demonstration #1 (avi, 980 Kb)
- Demonstration #2 (avi, 1.1 Mb)
AMAS4BigData
This video shows the result of a new artificial collective intelligence, called ‘DREAM (Dynamic data Relation Extraction using Adaptive Multi-agent systems)’, applied on the data generated during several hours from neOCampus IoT, the sensors network of Paul Sabatier University - Toulouse 3.
‘DREAM’ A.I finds data relations based on a data dynamics similarity and a cooperative exploration with limited computational power and no knowledge of the data sematic (it doesn’t know what the data mean). This A.I studies in real-time data from several sources, like sensors: Luminosity, temperature, C02, humidity...
The result is a dynamic graph wherein a node represents a data source (sensor) and an edge (link) embodies a dynamics relation between two data sources. The A.I ‘DREAM’ creates a relation when two sources evolve and change in a similar way, over time, even if they are time-shifted. A color code (heat map) expresses the strength of relationships: going gradually from blue (weak relation) to red (strong relation).
As you can see, the A.I discovers initially some relations here and there all over the set of sensors due to its first mechanism, the ‘random exploration’. Then, it starts to make up clusters (set of sensors that are related to each other) efficiently thanks to its second mechanism, the ‘Transition’. Finally, clusters of sensors gather as a result of ‘DREAM’ first mechanism and third mechanism, the ‘Relaxation’, which leads to a graph of related sensors.
Moreover, the relations are continuously updated. Therefore, the relations strength may change and relations disappear, if they became too weak to be sustained, and new ones can appear anytime according to the A.I three mechanisms.
See also the PhD thesis related to this demonstration
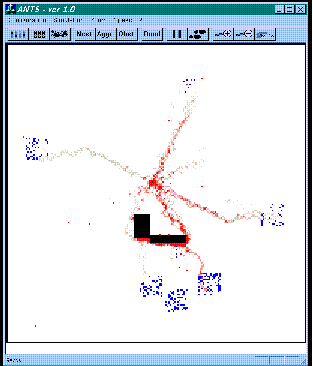
ANTS
Ants is a comparative evaluation of self-organised cognition models in natural and artificial systems.
- Demonstration (avi, 140 Kb)
CoCell: Cell Communication
The CoCell platform is a program developed in C++ that uses the Qt library for the human interface and OpenGL for custom graphics. The dependencies are cross-platform making CoCell compatible with Windows and Linux. The application takes advantage of multi-core processors when possible. Some more details on the CoCell platform are given in the PhD thesis related to this work.
The first demonstration presents the different windows and functionalities of the platform.
The second demonstration shows the active diffusion of a resource R following signal requests in a 3D space. The resource is initially located only in the center of the system space. The cells behave altruistically and do not hesitate to yield all their personal stock of this resource to help neighboring cells if they receive the appropriate request. What happens in this case is that during the phase leading to a dynamic equilibrium, cells alternate between requesting the request and releasing it to help others. At some point all cells become synchronized and alternatively gather and release the resource together in the environment, creating a pulsating time pattern.
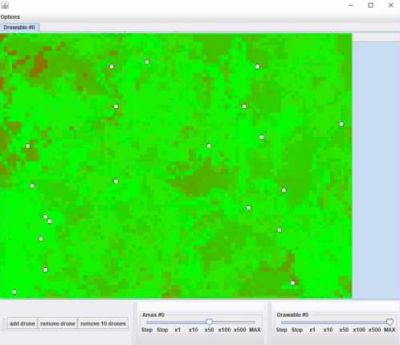
Surveillance of areas with a swarm of drones
The video of the demonstration (below) is an example of how AMAS technology may be used to control drones.
These drones are totally autonomous and do not communicate but perceive each other at short range for avoidance.
The problem consists in monitoring an area of 100 x 100 elementary parcels. Each parcel has a specific surveillance level (from 1 to 5) depending on their required observation frequency (building doors, area entries, intrusion...).
Visually, green means that the surveillance of a parcel is sufficient, and bright red shows that this a parcel is insufficiently observed.
Sequence of events in the demonstration video:
- A drone perceives an area of 5 x 5 parcels below it, it knows the criticity of each parcel as well as other drones which might be there.
- At the beginning of the demonstration, there are 20 drones and the monitoring is considered good.
- Around the middle of the demo, two areas are arbitrarily coloured in red by a human operator for indicating that they must be monitored quickly.
- At the end, only 12 drones are left (simulating a failure of the other 8) and a progressive difficulty for monitoring the global area can be observed.
The collective activity of monitoring is totally emergent and there is no strategy evolution during the simulation, even when drones are removed.
The local decision making could be enriched in an incremental way by additional factors (battery recharging, communication between drones...).
- Demonstration (mp4, 11 Mb)
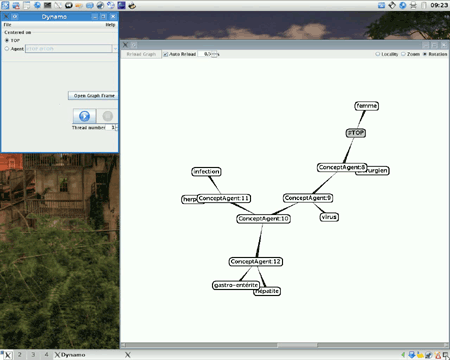
DYNAMO
- Demonstration #1 (avi, 2.1 Mb)
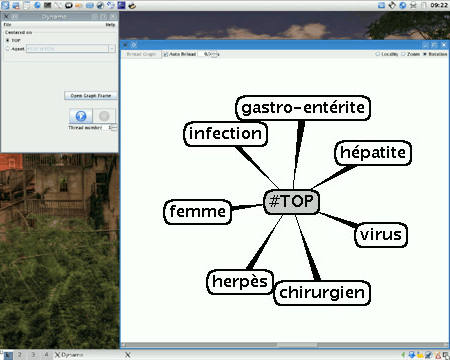
- Demonstration #2 (avi, 1.8 Mb)
GAMA
GAMA is a modeling and simulation development environment for building spatially explicit agent-based simulations.
- Multiple application domains : Use GAMA for whatever application domain you want.
- High-level and Intuitive Agent-based language : Write your models easily using GAML, a high-level and intuitive agent-based language.
- GIS and Data-Driven models : Instantiate agents from any dataset, including GIS data, and execute large-scale simulations (up to millions of agents).
- Declarative user interface : Declare interfaces supporting deep inspections on agents, user-controlled action panels, multi-layer 2D/3D displays & agent aspects.
See:
https://www.youtube.com/watch?v=ycbeYxV2B7M
https://www.youtube.com/watch?v=hITBYKg6Efs
It is developed in collaboration between UMI 209 UMMICO (IRD/University Paris Sorbonne), MSI Research Team (Vietnam National University, Hanoi), UMR 6228 IDEE ( CNRS/University of Rouen), UMR 5505 IRIT (CNRS/University of Toulouse 1), DREAM Research Team (University of Can Tho, Vietnam), UMR 8623 LRI (CNRS/University Paris-Sud).
Official website: http://gama-platform.org/
MICROMEGA
microMéga aims at modelling microbial dynamics with adaptive multi-agent systems by integrating molecular and macroscopic data.
- Example of glycolysis (avi, 29 Mb)
PPP
The "Progressive Party Problem" is an optimisation problem related to a party planning with a yacht rally background.
In the presented simulation, several examples with different numbers of boats are outlined but the number of periods is implicitly set at six in the demonstration tool.
- Demonstration tool (zip, 2Mb)
Install
The Java executable file is embedded in the downloadable zip file (2 Mb). You need to install at least JRE 1.5 to execute it.
Unzip the provided zip file in order to obtain a jar} file (SMAC_PPP.jar), a lib directory (which contains the non-standard libraries that are needed to visualise notably results and statistics), two help files (about.txt and help.txt) and a description file for a problem (in French, {Smac_ppp.xls}).
Then execute the {jar} file using JRE.
Help
(This help is also available via the menu of the executable file)
Menus Description
Files Menu
-
Initialiser Item: Initializes a new simulation from a given data file. These data are stored in an Excel file with the ".xls" extension (The original problem is in the "Smac_ppp.xls" file):
- The first column of the file indicates the capacity of the boat (crew + embarked crews),
- The second column expresses the crew size,
- The third column defines the initial role of the boat ("H" for a host boat, "G" for a guest boat) .
- Quitter Item : Stops execution.
Run Menu
This menu is active when a new file is loaded.
A simulation is composed of several sessions. The optimal session which enables to put the greatest number of guests while minimising the number of host boats, has to be found. A session is made up of six periods, during which crews are meeting.
- Run Item: Launches a new simulation. This item takes a new Pause label.
- Pause Item: Hangs the simulation. The simulation is interrupted after the current period. This item takes Continue as a label.
- Continue Item: Continues the simulation. This item takes Pause as a label.
- StartSession Item: Executes the simulation on a step-by-step basis, stopping after every session. This item takes a StepSession label.
- StepSession Item: Executes the next session.
- StartPeriod Item: Execute the simulation on a step-by-step manner, stopping after every period. This item takes a StepPeriod label.
- StepPeriod Item: Executes the following period.
- Stop Item: Stops simulation.
Windows Description
" Résultats" Tab
This window contains the simulation results.
- "Abcisse" : number of session.
- "Ordonnée" : The histogram shows, for each session, the number of host boats in red and the number of periods in blue.
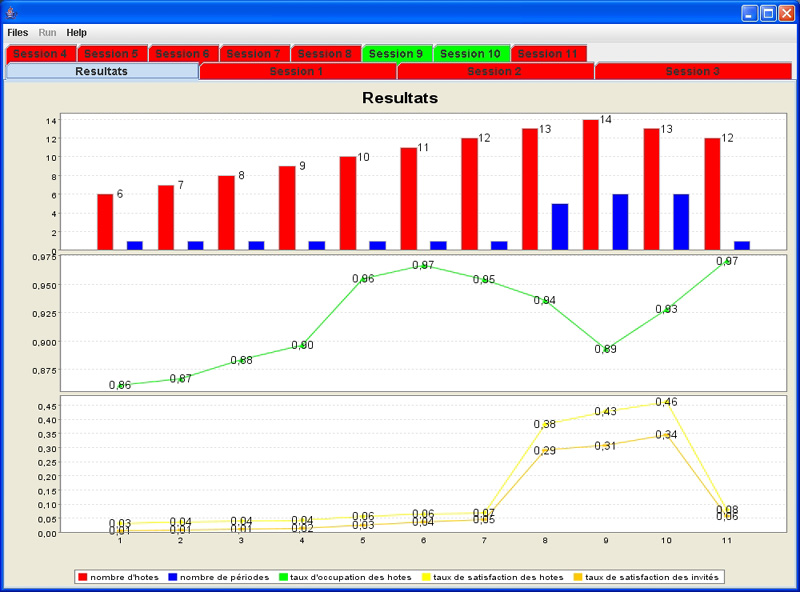
The first plot shows the mean occupancy ratio of the host boats. The second graph shows the hosts and guests satisfactions for each session. In yellow, the mean percentage of guest boats that are embarked by hosts and in orange, the mean percentage of boats met by guests..
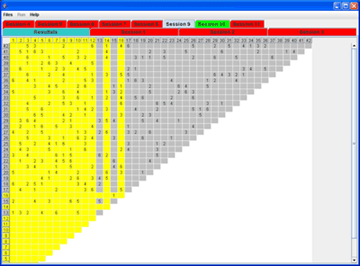
Session Tab
It shows the position of boats during the numbered session, in a dynamic way. A green tag signifies that all the boats were able to find a location during the six periods. A red tag shows that a boat has not find a location during a period, the session was not able to end. The triangular-shaped table shows the affectations that were made:
- on the x-axis and y-axis, the number of boat is put,
- the yellow color indicates a host boat,
- the number of period within which a meeting took place is found at the intersection of a row and a column.
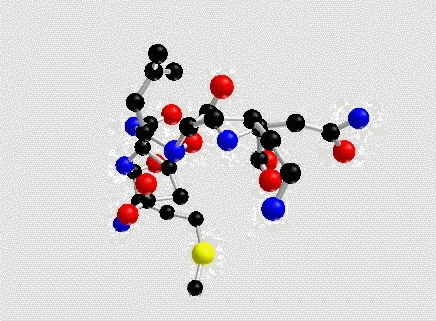
Molecule Folding
The aim of Bio-S was first to solve protein folding by minimising Lennard-Jones energy coming from van der Waals forces. In a second step, this ability to minimize the potentiel energy of a molecule was used for learning the functions governing interactions between atoms.
- Demonstration (avi, 7 Mb)
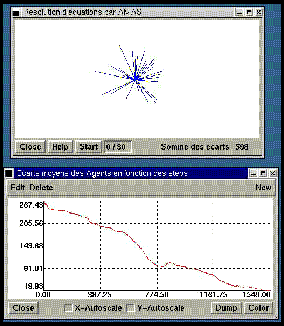
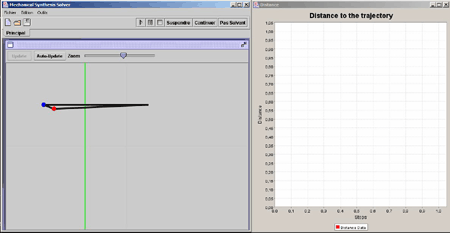
Equation Solving
See the French page for the problem description.
- Demonstration #1 (zipped avi, 28 Mb)
- Demonstration #2 (zipped avi, 27 Mb)
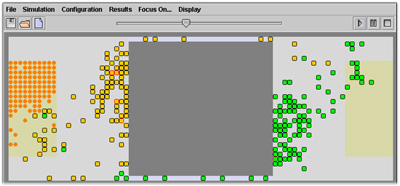
Conveyor Robots
Robots are carrying resources (orange dots) from one room to another using two corridors too narrow for letting two robots pass each other. More details (in French) in [Picard, 2005]. A green robot is not loaded and becomes yellow when it is loaded.
The first video shows the beginning of the execution. Conflicts between robots (e.g., when they meet in a corridor) are shown in red.
- Towards the beginning of the execution (avi, 9 Mb)
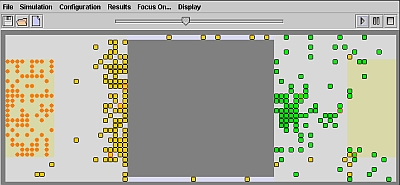
As the execution moves along, two traffic directions are emerging from the interactions between the cooperative agents which model the robots. These directions where not predefined in the source code.
- Emergence of a traffic direction (avi, 6 Mb)
STAFF
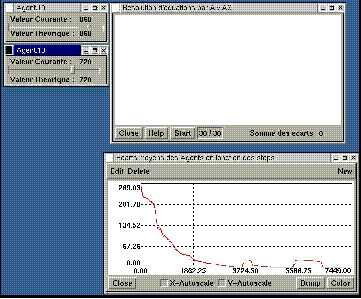
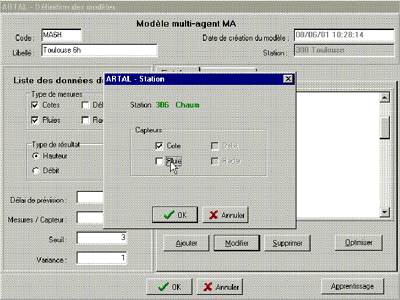
The aim of the STAFF (Software Tool for Adaptative Flood Forecast) project was to forecast in an adaptive manner floods; to provide a predictive self-adaptive tool in any environment equipped with sensors for observing natural phenomena.
This demonstration is an example of using STAFF in the Sophie product, a software platform for forecasters which enables the management and use of several models for all the station of the Adour-Garonne Basin.
- Demonstration (zipped avi, 89 Kb)
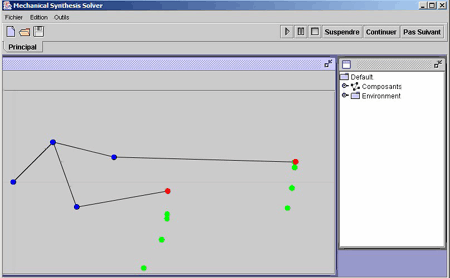
SYNAMEC
The objective of SYNAMEC was to build an integrated general-purpose software for the structural (type) and dimensional syntheses of mechanisms, starting from a specification of functional requirements.
- Demonstration #1 (avi, 3 Mb)
- Demonstration #2 (avi, 13 Mb)